Model
Suppose we want to perform binary classification on some data.
d1 <- rnorm(100, mean = 5, sd = 1)
d2 <- rnorm(100, mean = 4.5, sd = 1)
df <- tibble(d1, d2) %>% pivot_longer(cols = d1:d2)
df %>% head(5)
# A tibble: 5 × 2
  name  value
  <chr> <dbl>
1 d1     4.84
2 d2     4.44
3 d1     4.27
4 d2     5.42
5 d1     6.86
Let’s try a simple linear model:
simple_linear_regression <- lm(value ~ name, df)
summary(simple_linear_regression)
Call:
lm(formula = value ~ name, data = df)

Residuals:
     Min       1Q   Median       3Q      Max
-3.14727 -0.63813 -0.01111  0.72165  2.15889

Coefficients:
            Estimate Std. Error t value Pr(>|t|)
(Intercept)  4.92600    0.09963   49.44  < 2e-16 ***
named2      -0.59035    0.14090   -4.19  4.2e-05 ***
---
Signif. codes:  0 '***' 0.001 '**' 0.01 '*' 0.05 '.' 0.1 ' ' 1

Residual standard error: 0.9963 on 198 degrees of freedom
Multiple R-squared:  0.08144,   Adjusted R-squared:  0.0768
F-statistic: 17.55 on 1 and 198 DF,  p-value: 4.202e-05
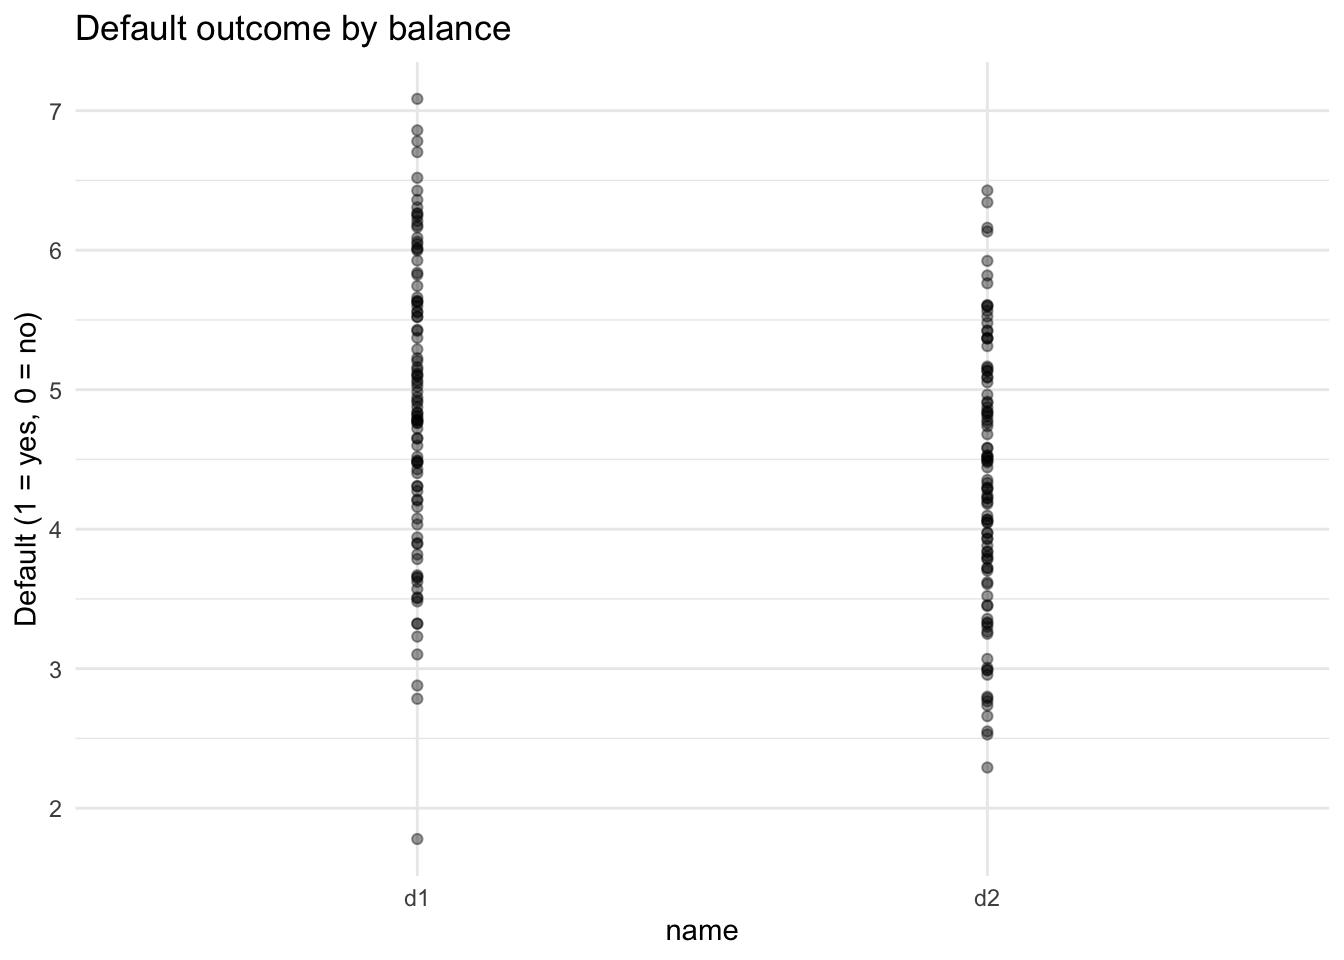
Let’s plot this!
df %>% ggplot(aes(y = value, x= name)) +
  geom_point(alpha = .4) +
  geom_smooth(method = "lm") +
  labs(y = "Default (1 = yes, 0 = no)",
       title = "Default outcome by balance") +
  theme_minimal()
`geom_smooth()` using formula = 'y ~ x'